Search
Results
envision - demos
Demos - JavaScript InfoVis Toolkit
Wind Map
Online Python Tutor: Learn and practice Python programming in your web browser
Maps » Ape Con Myth
APOD: 2012 March 12 - The Scale of the Universe Interactive
ChronoZoom
Beautiful Weather Graphs and Maps - WeatherSpark
Up and Down the Ladder of Abstraction
One Hundred Million Dollar Penny - YouTube
US debt visualized: Stacked in 100 dollar bills @ 15 Trillion Dollars - Equal to US GDP 2011
logstalgia - website access log visualization - Google Project Hosting
Real-time local Twitter trends - Trendsmap
Bricoleurbanism » Urban Design
Global Rich List
Infographics & Data Visualizations - Visual.ly
Wordle - Beautiful Word Clouds
Neoformix - Discovering and Illustrating Patterns in Data
US road accident casualties across: every one mapped across America | News | guardian.co.uk
[http://www.guardian.co.uk/news/datablog/interactive/2011/nov/22/us-road-accident-casualties] - - public:time
BBC News - Eurozone debt web: Who owes what to whom?
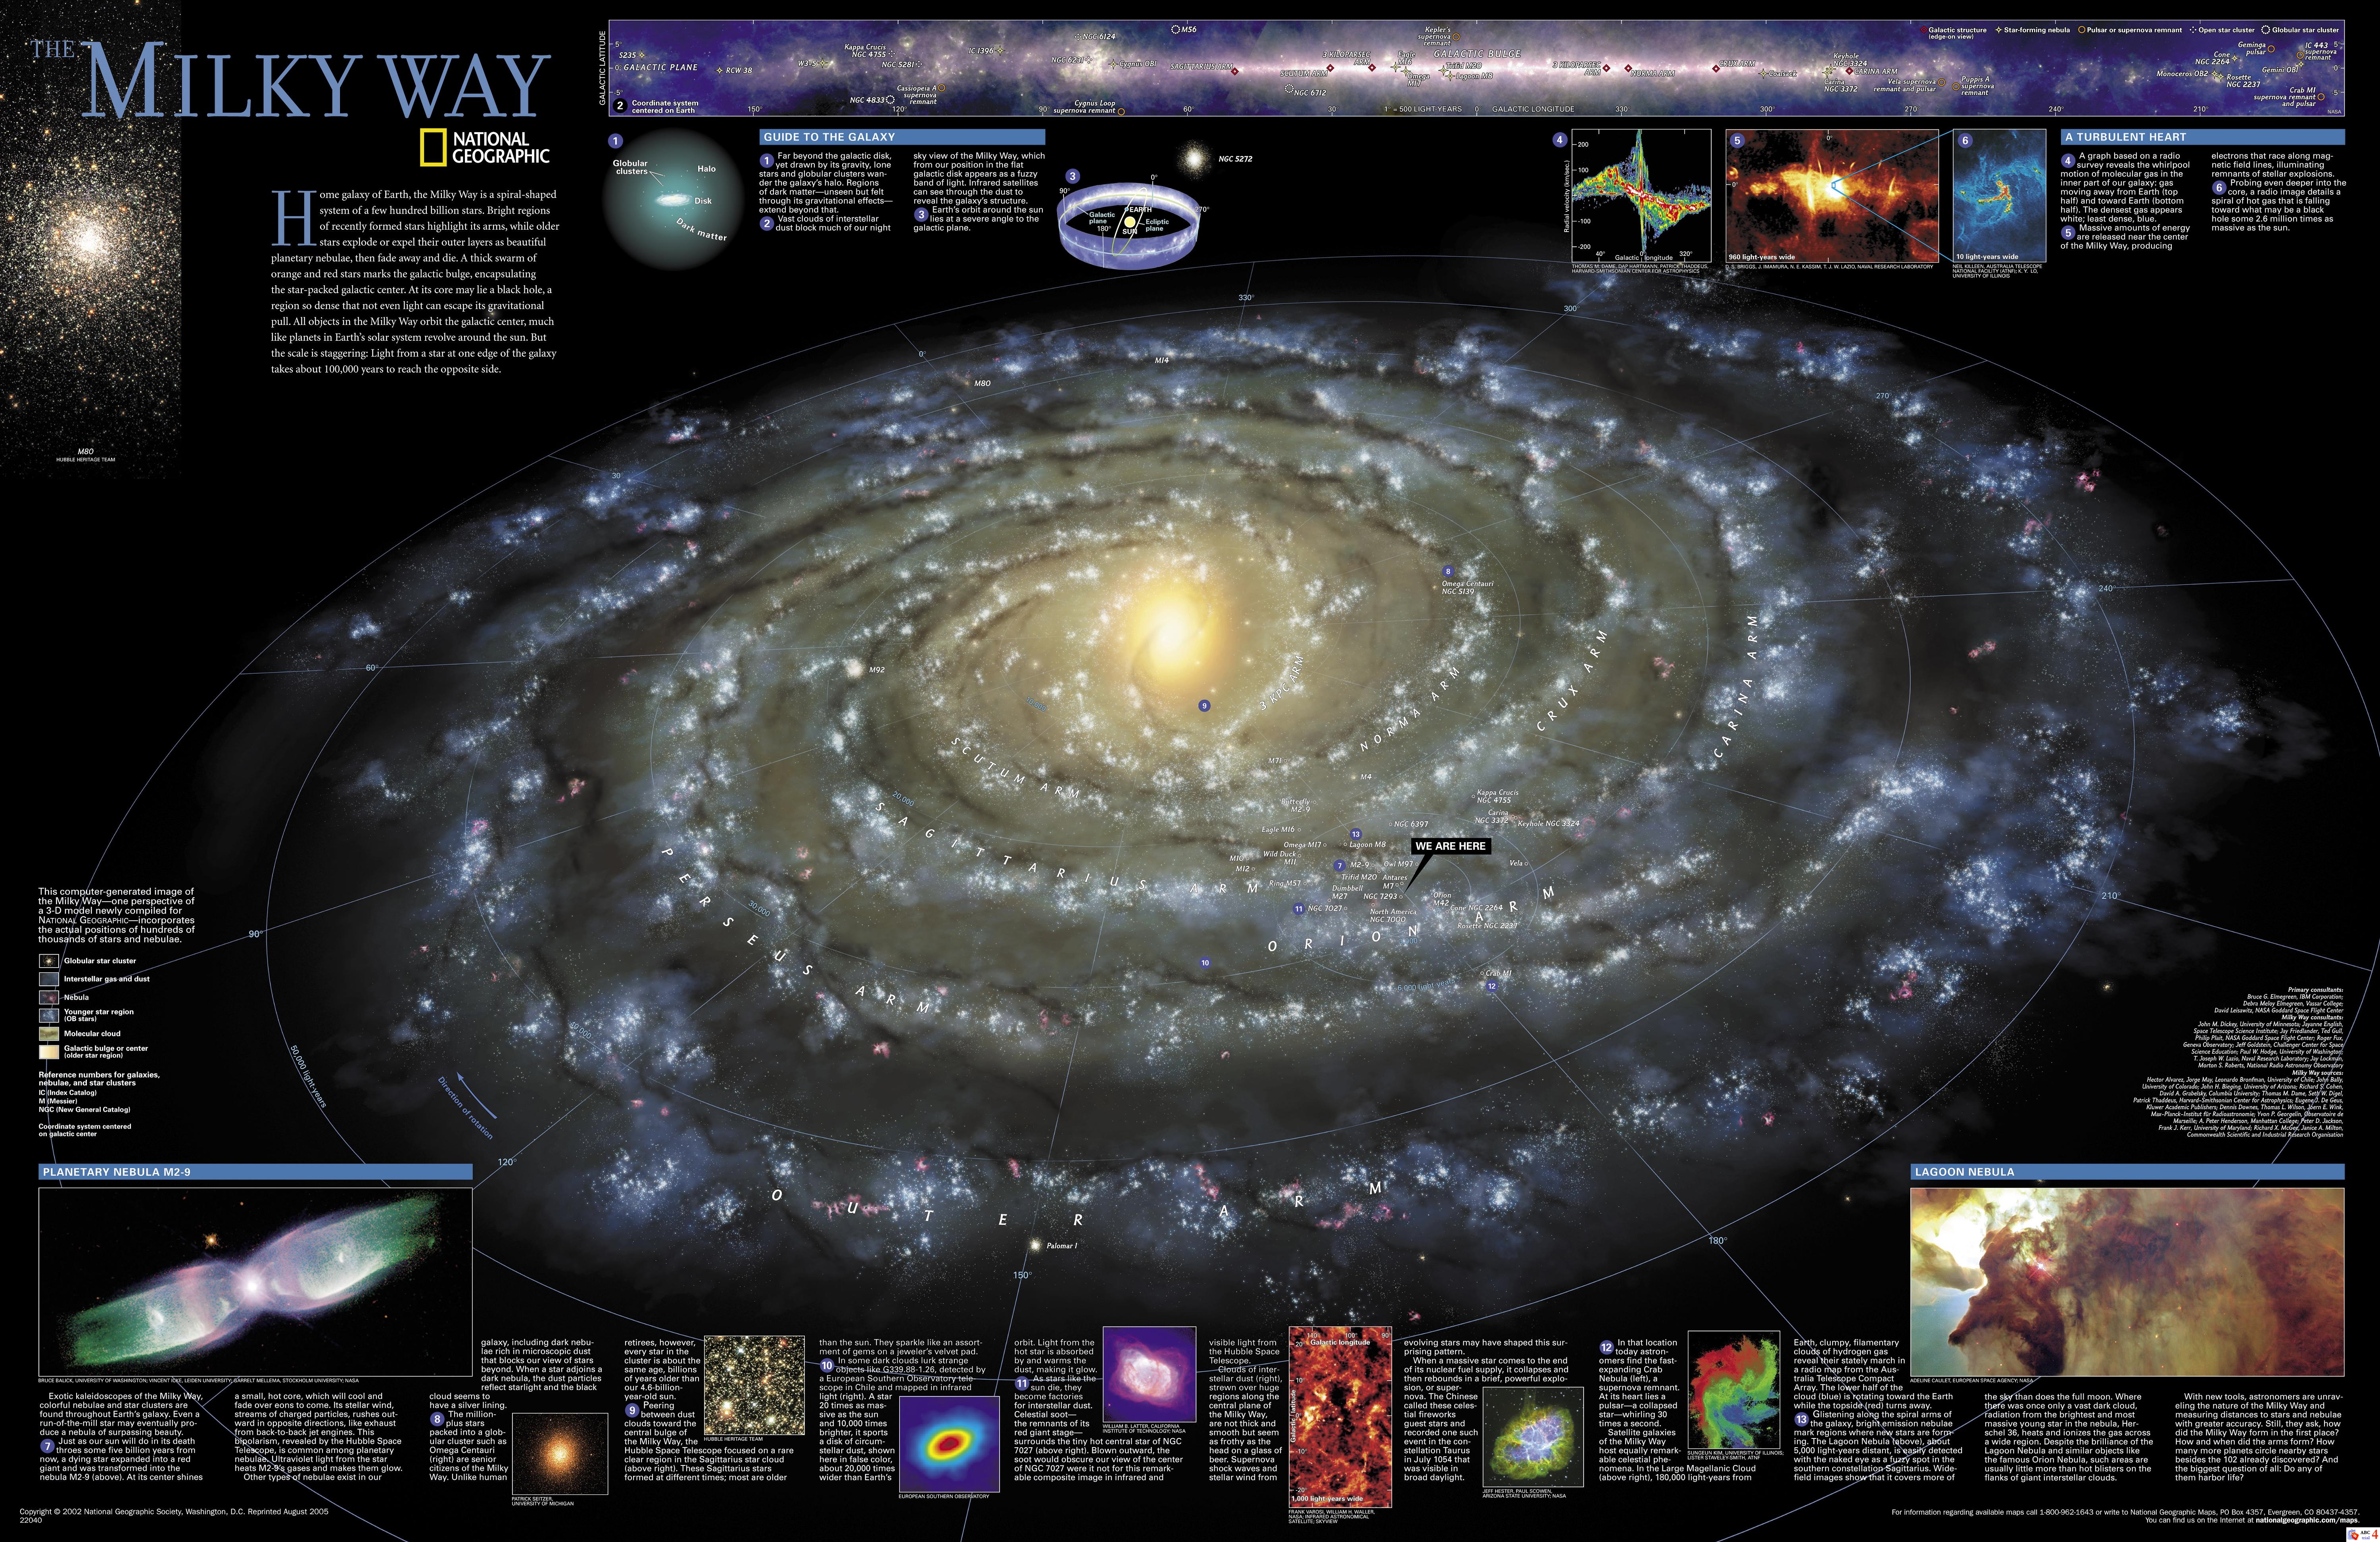
national-geographic-milky-way-reference-map1.jpg (JPEG Image, 6000x3887 pixels) - Scaled (16%)
[http://tzontonel.files.wordpress.com/2008/12/national-geographic-milky-way-reference-map1.jpg] - - public:time
Google Code Playground
pChart | a PHP Charting library
Tilt
Gephi, an open source graph visualization and manipulation software
Dynamic Periodic Table
Real-time Web Monitor
Infographic Of The Day: The Definitive Guide To Crazy Coffee Drinks | Co. Design
[http://www.fastcodesign.com/1664869/infographic-of-the-day-whats-in-that-coffee-drink] - - public:Yabalicious
Mapping the riots with poverty
[http://www.guardian.co.uk/news/datablog/interactive/2011/aug/10/poverty-riots-mapped] - - public:ghiberti
Projets | ARTEFACTORYLAB
GunnMap 2
Global recession - where did all the money go? | Business | guardian.co.uk
[http://www.guardian.co.uk/business/dan-roberts-on-business-blog/interactive/2009/jan/29/financial-pyramid] - - public:Yabalicious
Why Greece Sovereign Debt matters to Australia
maptd | A blog about maps
JOURNEY OF MANKIND - The Peopling of the World
FusionCharts v3 - Stunning Charts in Flash & JavaScript (HTML5) for Web & Enterprise
QlikCommunity: amMap & FusionMaps Integration
Data Visualisation References « CrisisMaven's Blog
[http://crisismaven.wordpress.com/references/references-subjects-covered/data-structuring/data-visualisation-references/] - - public:ghiberti